
How do you debug Selenium test cases?
Introduction
Have you ever written a perfect Selenium test script, only to see it fail for reasons you can’t immediately understand? You’re not alone. Debugging Selenium test cases is a skill every automation tester must master, especially when preparing for a Selenium certification or progressing through a Selenium certification course.
Selenium automation testing is powerful but not always straightforward. The complexity of web applications, dynamic elements, and browser-specific behavior can all lead to unexpected test failures. Whether you’re enrolled in an online Selenium certification program or learning on the job, understanding how to debug your Selenium test cases is crucial for success.
In this blog post, we’ll dive deep into:
-
Common reasons why Selenium tests fail
-
Step-by-step debugging techniques
-
Real-world code examples
-
Practical tools that support debugging
-
Best practices for long-term success
Whether you're taking a Selenium certification online or just sharpening your skills, this guide is built for you.
Why Debugging Matters in Selenium Automation Testing
Debugging is more than just fixing errors it’s about improving reliability, maintaining test accuracy, and saving time in the long run. Automation tests that fail without a clear reason reduce confidence in the test suite and slow down the development cycle.
According to a recent industry report, nearly 65% of automation testers spend over 30% of their time debugging scripts. If you're considering a Selenium certification, developing solid debugging skills will give you a competitive edge.
Common Reasons Selenium Tests Fail
Understanding the root causes of test failures is the first step toward debugging effectively. Here are the most common reasons:
1. Element Not Found Errors
-
The locator might be incorrect or no longer valid.
-
The element might be inside an iframe or shadow DOM.
2. Timing and Synchronization Issues
-
The element appears after a delay, but the script checks for it too early.
-
Page transitions or animations are not accounted for.
3. Incorrect Locators
-
Using brittle XPath or CSS Selectors.
-
Changes in the UI that break existing locators.
4. Browser or Driver Compatibility
-
Inconsistent behavior between Chrome, Firefox, and Edge.
-
Outdated WebDriver binaries.
5. Network or Server-Side Errors
-
Sluggish internet connections.
-
Backend not responding or data not loading.
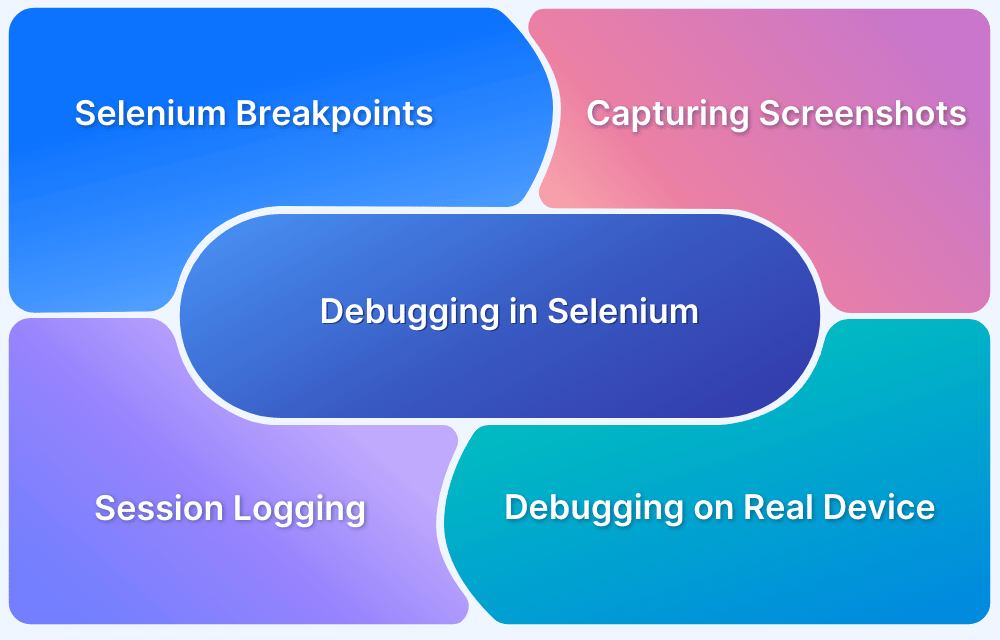
Debugging Techniques in Selenium
Here are detailed, real-world approaches you can apply today. These techniques are used by professionals and taught in reputable Selenium certification courses.
1. Add Breakpoints and Step Through the Code
Using an IDE like Eclipse or IntelliJ:
-
Set breakpoints by clicking next to the line number.
-
Start your test in "Debug Mode."
-
Use step-in and step-over controls to execute one line at a time.
Why it works: It allows you to pause and inspect variable states, helping you pinpoint the exact line causing failure.
2. Use Explicit Waits
One of the most common mistakes is assuming the element is ready for interaction. Instead of using Thread.sleep(), use WebDriverWait with expected conditions.
java
WebDriverWait wait = new WebDriverWait(driver, Duration.ofSeconds(10));
WebElement button = wait.until(ExpectedConditions.elementToBeClickable(By.id("submit")));
button.click();
Why it works: Prevents premature interactions with elements that aren’t yet visible or enabled.
3. Capture Screenshots Automatically
Take screenshots at key points in your test or after exceptions.
java
public void takeScreenshot(WebDriver driver, String fileName) {
File screenshot = ((TakesScreenshot) driver).getScreenshotAs(OutputType.FILE);
File destFile = new File("screenshots/" + fileName + ".png");
try {
Files.copy(screenshot.toPath(), destFile.toPath());
} catch (IOException e) {
e.printStackTrace();
}
}
Use Case: Run this in a catch block or after each step.
4. Use Logging to Understand Test Flow
Use Java’s built-in logging or a library like Log4j to capture information during test runs.
java
Logger logger = Logger.getLogger("MyLog");
logger.info("Navigating to login page");
logger.error("Element not found: login button", e);
Why it works: Logs help reconstruct what happened in the test and at what point it failed.
5. Inspect Elements Using Browser DevTools
Use browser tools (F12 or right-click → Inspect) to:
-
Verify if the locator is correct.
-
Check element visibility.
-
Understand the DOM structure, especially for dynamic elements.
Advanced Debugging Techniques
As you advance in Selenium automation testing or prepare for your Selenium certification online, consider these pro-level tactics.
1. Debug With JavaScript Executor
Sometimes Selenium can’t interact with certain elements. Use JavaScript as a workaround.
java
JavascriptExecutor js = (JavascriptExecutor) driver;
js.executeScript("arguments[0].click();", element);
Use With Caution: Bypasses standard Selenium interactions and may hide issues.
2. Print the DOM or HTML Snippets
Capture the entire HTML or partial DOM for deeper inspection.
java
System.out.println(driver.getPageSource());
This helps you detect if the page was fully loaded or if dynamic content failed to render.
3. Reproduce Failures with Isolated Scripts
If a test step fails, try isolating that step in a smaller test to reproduce the error.
This allows quicker debugging without rerunning the entire test suite.
4. Validate Browser Logs
You can pull browser console logs to detect JavaScript errors.
java
LogEntries logs = driver.manage().logs().get(LogType.BROWSER);
for (LogEntry entry : logs) {
System.out.println(entry.getMessage());
}
Why it matters: Silent frontend errors could be crashing your UI, causing test failures.
Hands-On Debugging Example
Let’s walk through a practical example.
Scenario: Login button is not clickable
java
WebElement loginButton = driver.findElement(By.id("login"));
loginButton.click();
Debugging Steps:
-
Add a breakpoint and run in debug mode.
Use isDisplayed() and isEnabled():
java
System.out.println("Visible: " + loginButton.isDisplayed());
System.out.println("Enabled: " + loginButton.isEnabled());
-
Take a screenshot before the click.
Add an explicit wait:
java
WebDriverWait wait = new WebDriverWait(driver, Duration.ofSeconds(10));
wait.until(ExpectedConditions.elementToBeClickable(By.id("login")));
Common Debugging Mistakes (and How to Avoid Them)
-
Overusing Thread.sleep(): Leads to flaky tests and wasted time.
-
Hardcoding Locators: Use Page Object Model for maintainability.
-
Ignoring Wait Conditions: Leads to premature actions.
-
Not Using Logs: Without logs, you lose valuable insight into the test flow.
-
Skipping Screenshot Capture: Missed opportunity to visualize the failure.
Best Practices for Debugging Selenium Test Cases
|
Practice |
Why It Matters |
|
Use Explicit Waits |
Improves reliability in dynamic pages |
|
Modularize Your Code |
Easier to isolate and debug individual functions |
|
Centralize Locators |
Simplifies updates and avoids duplication |
|
Maintain a Screenshot Library |
Helps diagnose historical test failures |
|
Log Step-by-Step Execution |
Provides clarity during debugging |
|
Run Tests in Headed Mode First |
Easier to observe UI interactions |
|
Keep Browser & WebDriver Updated |
Prevents compatibility issues |
Practical Relevance to Selenium Certification
Debugging skills are frequently tested in Selenium certification online exams. Courses often include sections on handling exceptions, writing stable locators, and analyzing failed test cases.
By mastering these techniques, you’ll:
-
Write more reliable test cases.
-
Reduce flaky test results.
-
Improve your efficiency as a test automation engineer.
-
Boost your confidence when taking a Selenium certification course.
Key Takeaways
-
Understand why your test failed before you fix it.
-
Use tools like screenshots, logs, and breakpoints to gather evidence.
-
Apply structured debugging practices don’t just guess.
-
Avoid over-reliance on Thread.sleep().
-
Stay calm debugging is a skill you build with practice.
Conclusion
Debugging is a critical skill that separates good testers from great ones. Whether you're pursuing a Selenium certification, enrolled in a Selenium certification course, or self-learning through an online Selenium certification, these techniques will help you build stable, reliable, and maintainable automation scripts.
Ready to level up? Start applying these techniques in your own test projects and accelerate your journey in Selenium automation testing!
Take your Selenium skills to the next level, debug smart, not hard.
- Questions and Answers
- Opinion
- Motivational and Inspiring Story
- Technology
- True & Inspiring Quotes
- Live and Let live
- Focus
- Art
- Causes
- Crafts
- Dance
- Drinks
- Film/Movie
- Fitness
- Food
- Jogos
- Gardening
- Health
- Início
- Literature
- Music
- Networking
- Outro
- Party
- Religion
- Shopping
- Sports
- Theater
- Wellness
- News
- Culture