SUPPLY CHAIN TIMELINE: China’s Rise in Global Trade & Supply Chain Power.
Year | Key Event | Impact
1978 | Deng Xiaoping launches "Reform and Opening Up" | Shift from planned economy to market reforms; welcomes foreign investment.
1980s | Special Economic Zones (e.g., Shenzhen) established | Factories explode in growth, becoming hubs for global export.
1990s | Explosive growth in textiles, toys, electronics | Western companies begin outsourcing en masse to cut costs.
2001 | Joined WTO (World Trade Organization) | China gets full access to global markets — boom in exports.
2000s | "Factory of the World" status | Apple, Nike, Walmart and others shift most production to China.
2010s | Moves up the value chain (tech, EVs, solar) | No longer just cheap goods — now high-tech industries flourish.
2013 | Belt & Road Initiative (BRI) launched | Expands China’s trade routes via ports, railways, and pipelines.
2018 | U.S.-China trade war begins | Tariffs reveal vulnerabilities in global overdependence on China.
2020 | COVID-19 hits | Lockdowns in China freeze global supply chains. Wake-up call.
2021–2024 | Push for “dual circulation” & self-reliance | China focuses on internal demand while still dominating exports.
2024–2025 | U.S. and EU expand tariffs & decoupling efforts | Start of supply chain restructuring globally.
SUPPLY CHAIN MAP: China’s Dominance by Industry:-
Here’s how deep China is embedded in global supply chains:
Batteries & EV Components-
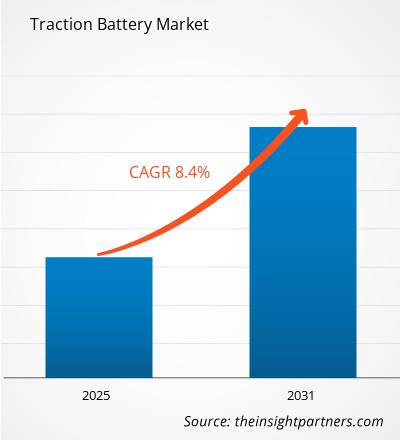
Control over 70–80% of global lithium-ion battery production.
Dominates refining of critical minerals (cobalt, lithium, graphite).
Solar Panels-
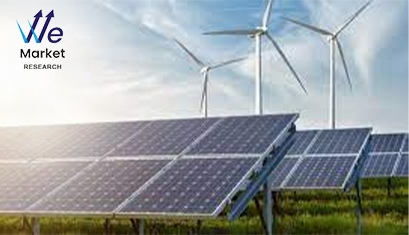
Over 80% of global solar panel supply is Chinese.
Controls polysilicon processing and solar cell manufacturing.
Electronics & Consumer Tech-
iPhones, laptops, and TVs are assembled or partially produced in China.
Shenzhen = world capital of hardware production.
Steel, Cement, Construction Materials-
World’s largest producer of steel & cement.
Heavily subsidized industries outcompete foreign competitors.
Textiles & Apparel-
Still one of the top 3 exporters of fabrics, clothing, and fast fashion components.
Pharmaceuticals & Chemicals-
Key supplier of Active Pharmaceutical Ingredients (APIs).
Many generics and vitamins rely on China.
Semiconductors (Assembly & Testing)
Doesn’t lead in chip design, but dominates assembly, testing, and lower-end chip production.
GLOBAL RESPONSES:- Who’s Doing What About China’s Dominance
United States-
CHIPS Act: $52B to boost U.S. semiconductor production.
IRA (Inflation Reduction Act): Billions in clean energy & battery production.
Tariffs & export bans: Restrictions on advanced chip exports to China.
“Friendshoring”: Pushing allies to build supply chains in safer zones.
India-
“Make in India” campaign: Big incentives for electronics, chips, and auto.
Attracting Apple, Samsung, and Foxconn for manufacturing shift.
Strategic partnerships with U.S. for tech and defense supply chains.
Vietnam-
Becoming a major alternative in apparel, electronics.
Samsung, Intel, and others now produce heavily there.
Mexico-
Rising as a nearshoring hub for the U.S.
Especially strong in autos, electronics, and logistics proximity.
Japan & South Korea-
Japan is onshoring critical industries, especially semiconductors and pharma.
Korea is expanding chip production globally (Samsung, SK Hynix) while also investing in allies.
European Union-
Launching “Net-Zero Industry Act” to scale solar, wind, and batteries.
Considering tariffs on Chinese EVs.
Focused on resilience, not full decoupling.
Why It All Matters:-
China’s rise was planned, strategic, and massive — and the world got hooked on cheap, fast production.
Now, geopolitics + economic security are driving a major global shift.
Countries are diversifying, investing at home, and building alliances to de-risk the future.
By Jo Ikeji-Uju.
sappertekinc@gmail.com
https://afriprime.net/Ikeji
*Share your comments positive or negative........


